Introduction
I am currently interviewing for a SecAI role. To be honest, I didn’t have prior InfoSec experience. While I’ve built various AI agents for different purposes, I hadn’t tackled cybersecurity before. To prepare, I built a specialized cybersecurity agent called SecAgent using pydantic-ai. Rather than attempting to cover every possible task, I focused on a concrete, high-value problem: alert triage analysis.
In this post, I want to share the practical lessons I learned throughout this process.
First, what is alert triage analysis, and why is it crucial? In modern cybersecurity operations, Security Operations Center (SOC) analysts are overwhelmed by the sheer volume of alerts generated daily by firewalls, IDS/IPS, endpoint security tools, SIEM platforms, etc. Analysts must prioritize these alerts and decide which ones require further investigation.
To simulate this environment, I set up Elasticsearch on Docker as a SIEM and generated realistic test alerts with Claude across 6 distinct scenarios:
- Brute Force: The attacker used an automated Python script to perform a sustained brute-force attack against a single user’s password.
- Password Spray: The attacker attempted a low-and-slow password spraying attack against 40 different accounts (generating 55 failures overall) from a single external IP.
- Impossible Travel: The same account authenticated successfully from two geographically distant locations within a very short timeframe.
- Off-hours Admin: A user authenticated successfully from an anomalous location (Germany) and time (10:45 PM) that fell outside their typical working patterns.
- Dormant Account: A user account that had been inactive for 120 days was used to log into the network.
- Service Account Misuse: A service account was used interactively to log in and access sensitive data.
I had Claude generate events for these scenarios and inject them into the Elasticsearch SIEM. You can inspect the raw alert dataset here: Alert Reports (CSV).
The important stuff here is how to design harness, which tools you should use, how to manage context and measure the best practices.
In particular, I want to focus on context compaction, as cybersecurity triage is inherently log-intensive.
Harness Design
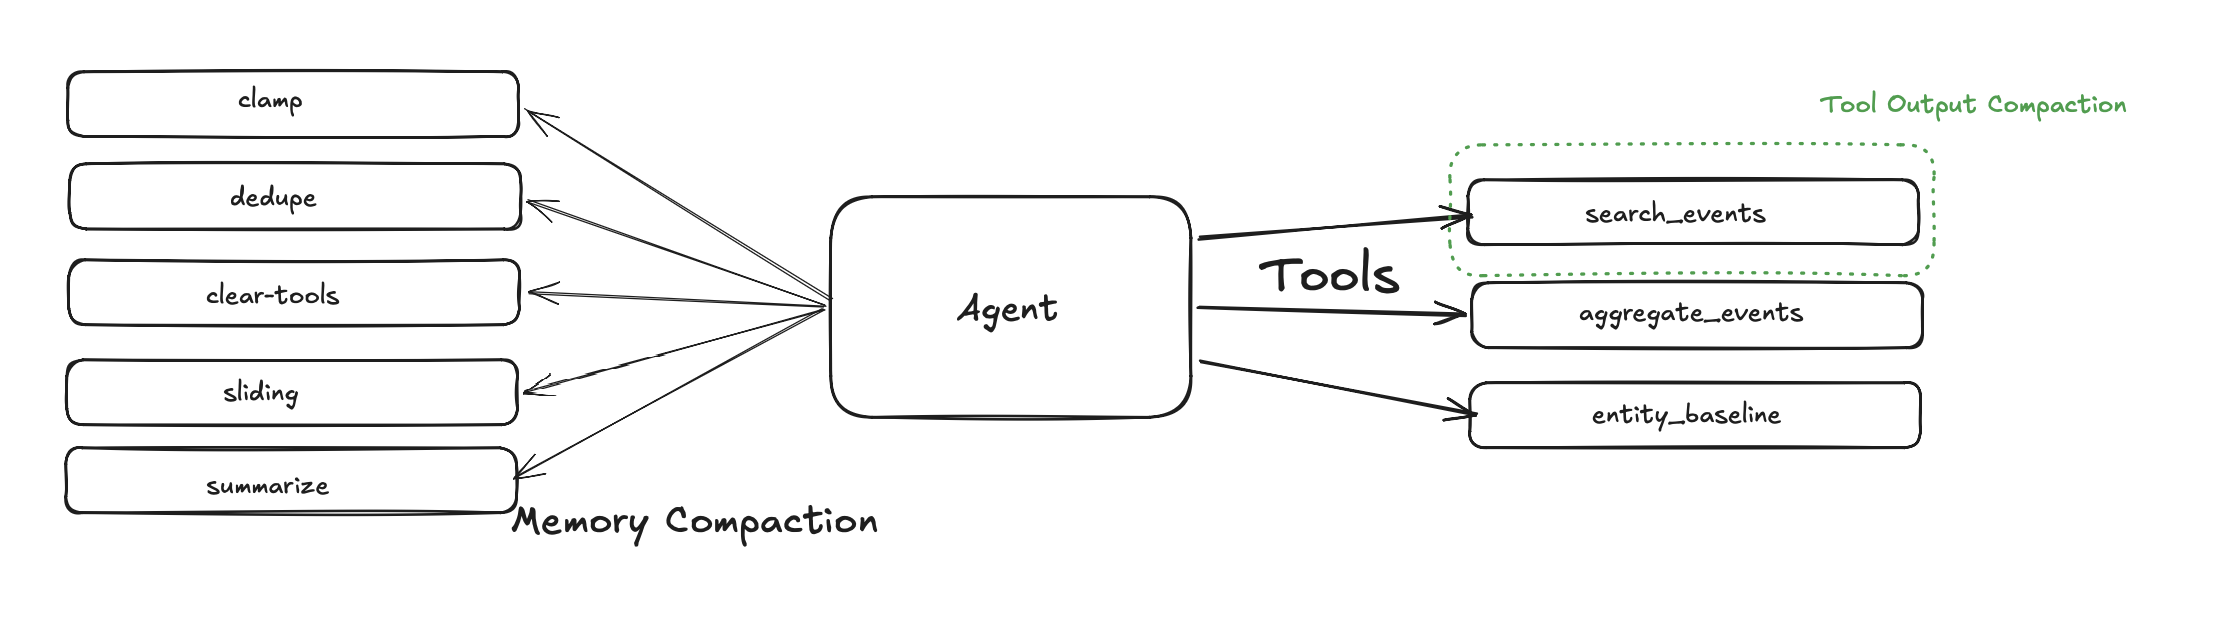
As shown in the architecture above, the setup consists of 3 core tools, 5 message-level compaction methods, and tool output compaction.
Core Tools
search_events: Fetches authentication events, sorted newest or oldest first.aggregate_events: Counts events grouped by a specified field over time.entity_baseline: Profiles what an entity normally looks like prior to the alert window.
Note: I asked Claude to suggest practical tools for this task and chose these three. If you come from a cybersecurity background and have better recommendations, please feel free to reach out!
Compaction Methods
clamp: UsesClampOversizedMessagesfrom thepydantic-ailibrary. It takes two arguments (keep_head_charsandkeep_tail_chars) and preserves only the first and last characters of oversized messages.dedupe: As the documentation describes: “When the same file is read more than once, only the latest read keeps its content; earlier reads are blanked with a placeholder.” Since we aren’t reading files in this scenario, its utility is limited here.clear_tools: Replaces older tool results with concise placeholders while keeping the most recentkeep_pairstool-call / tool-return pairs intact.sliding: Retains only the most recentkeep_messagesmessages and discards older ones.summarize: Performs recursive LLM-based summarization of conversation history. This is the most promising method for retaining semantic context, though one must be mindful of added token costs and latency.
Tool Output Compaction
The most effective way to optimize an agent is to understand how it interacts with the environment—identifying what the outputs look like and where bottlenecks emerge.
I used Logfire for tracing and observing agent execution. While inspecting traces, I discovered that the search_events tool frequently returned repetitive log entries:
log 1 - user1 logged in
log 2 - user1 logged in
log 3 - user1 logged in
...
log N - user1 logged in
Instead of returning verbose individual entries, compacting them into something like user1 logged in (N times) saves a substantial number of tokens.
To quantify these bottlenecks, I measured the raw token consumption across different tool calls:
| Tool Call (Scenario) | Tokens |
|---|---|
entity_baseline(user.name) | ~214 |
entity_baseline(source.ip) | ~116 |
aggregate_events(user.name) | ~24 |
aggregate_events(source.ip, interval=1m) | ~77 |
aggregate_events(..., interval=1h, 7d) | ~5,065 |
search_events(size=20) | ~4,264 |
search_events(size=50) | ~10,661 |
I got something unexpected I just thought search_events was the only tool output bottleneck but it wasn’t. As you can see from above aggregate_events is also very costly for the context window. So it’s best to properly benchmark and measure after something discovered.
After I implemented simple deterministic compaction I got those results in tool output token usage :
| Tool Call | Before | After | Reduction |
|---|---|---|---|
search_events(size=20) | 4,264 | 580 | −87% |
search_events(size=50) | 10,661 | 985 | −91% |
aggregate_events(1h, 7d) | 5,065 | 1,905 | −63% |